In this article:
View your mailing statistics
The performance of your last mailings are displayed in your Dashboard. You can also access the statistics of all your previous mailings from the menu.
Click the action menu icon at the right of a mailing and select the Statistics option to access to the detailed statistic page.
- From your Dashboard.

- From the menu, under Previous mailings, choose the option.
.png)
How your mailing statistics work
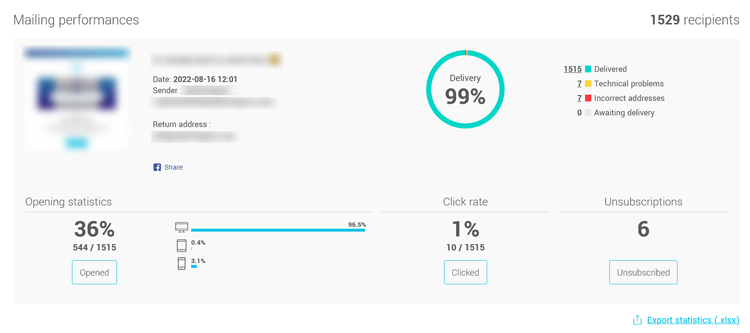
The purpose of the Mailing performances graphic is to give you a quick visual readout of your statistics.

Here's how the percentages in this graphic chart are calculated:
- Delivery rate
This is the number of emails delivered divided by the total of emails sent x 100. Emails that are classified as technical problems or incorrect addresses, i.e. bounces, are emails that have not been delivered.
- Opening rate
This is the percentage of emails opened. It is calculated as follows: number of emails that have been opened divided by the number of emails that were delivered x 100. For an email to be detected as "opened", the images must have been downloaded or the recipient must have taken an action, such as clicking on a link. The open rate is important because it shows how interested your subscribers are in opening an email just by seeing your subject line. However, it is not a very accurate measure, as some email clients automatically download images. On the other hand, a contact may have viewed your email, without necessarily displaying the images.
- Click rate
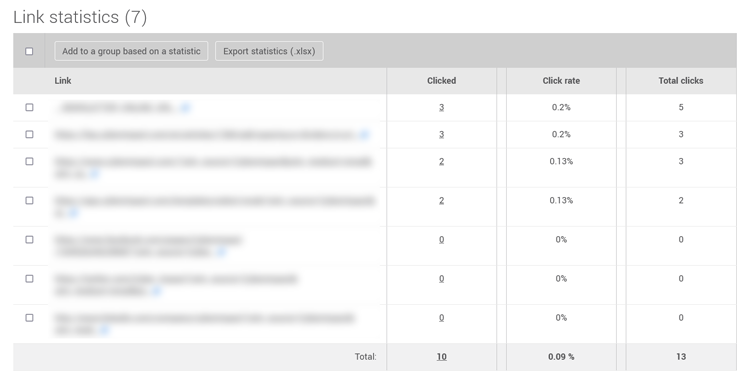
This is the number of emails with at least one click divided by the number of emails delivered x 100. Click-through statistics for each link are also available in the Link Statistics table, available at the bottom of the detailed statistics page. The click rate represents your subscribers' engagement with your email marketing campaign.
A good click-through rate is between 2 and 5%. This varies greatly from one industry to another.
If you notice unusual activity on your links, check out our article to learn more.
View the list of contacts of a mailing statistic
Here's how to get:
- The listing of contacts for a mailing statistic
- The listing of contacts who clicked on a specific link
- The listing of contacts who unsubscribed
Listing of contacts for a mailing statistic
To access the list of contacts of a statistic, such as the list of contacts who opened or clicked the email, simply click the number or button besides the statistic.
From the list of contacts, you will be able to add them to a group, if needed.
However, please note that contacts that appear grayed out in the lists are contacts that are no longer active since they were part of the mailing. They may have been deleted, unsubscribed or detected as an incorrect address. These contacts cannot be added to groups.
The listing of contacts who clicked on a specific link
A list of all links in your mailing is displayed under the Links statistics section at the bottom of the detailed statistics page of your mailing. By clicking on the numbers, you can see exactly which contact has clicked on each link.

Note: this list doesn't show up if the mailing had no link.
The listing of contacts who unsubscribed
Click the Unsubscribed button under this statistic to view the list of contacts who unsubscribed from this mailing.

View the statistics per group

If you sent to multiple groups, it may be interesting to compare the data for each one. This is shown in the Target groups table, under the mailing statistic graphic. You can click on the figures outlined in the table to access detailed information for each statistic.
Global account statistics
To view your account's global statistics such as the number of subscribers, unsubscribed contacts, express or implied consents, incorrect addresses, letters sent, and total openings, click the in the menu on the left of the screen.

In this page, you will also find a detailed table that allows you to track the number of emails sent during the current period and another table detailing the reasons why some contacts have unsubscribed from your mailings.
View the statistics of your dynamic blocks
In the complete statistics of a previous mailing, review the performance of your dynamic blocks. You will have access to two separate tables:
- Dynamic blocks
- Link statistics by dynamic block
Dynamic blocks
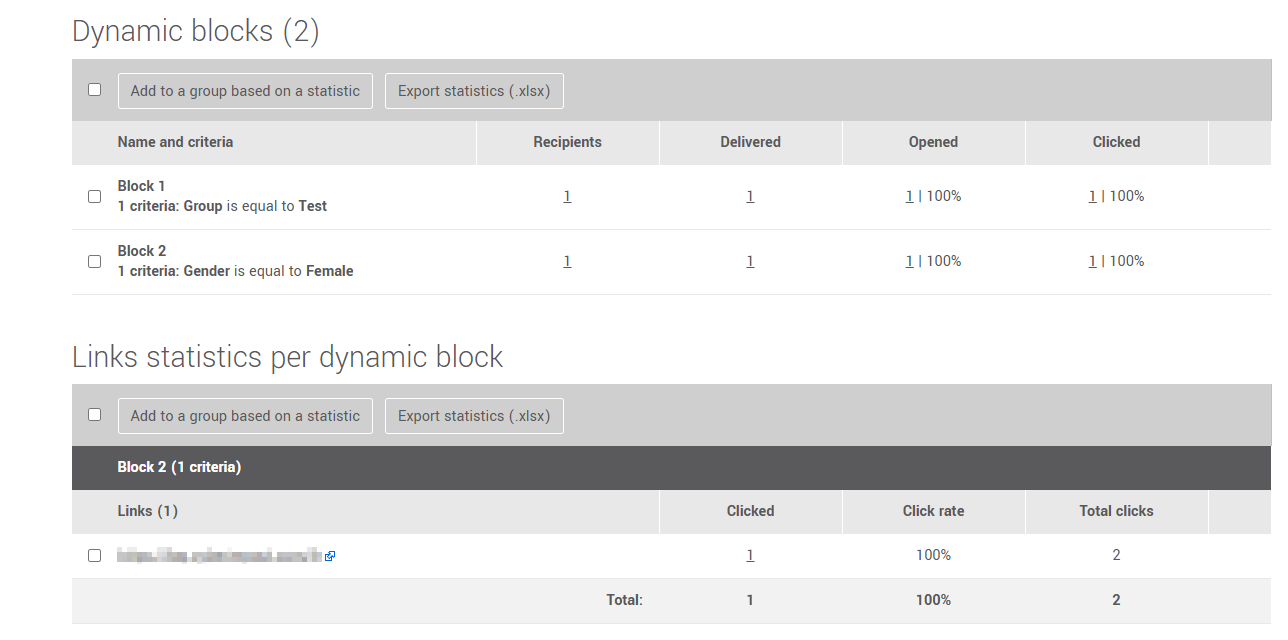
This table lists all the dynamic blocks in your mailing, along with their associated criteria. If you’ve assigned a custom name to your blocks, it will also appear here, making it much easier to identify them, especially when your mailing contains multiple dynamic blocks. You'll find key data such as:
- Number of recipients: Number of contacts who met the block’s criteria at the time of sending.
- Number of deliveries: Number of emails successfully delivered, corresponding to the recipients minus technical issues and invalid addresses.
- Number of opens: Number of contacts who opened the email, along with the open rate.
- Number of clicks: Number of contacts who clicked on at least one link in the email, along with the click rate. Only contacts who clicked on a link within this block will be included in the “Clicked” statistic.
Calculating the open and click rate of a dynamic block
The open and click rates of a dynamic block are calculated based on the emails delivered to recipients who met the block's visibility criteria. A contact is marked as having clicked only if they interacted with the dynamic block. This ensures that the statistics accurately reflect the engagement specifically related to that block
Link statistics by dynamic block
This table displays all links inserted into your dynamic blocks. You can view:
- The contacts who clicked on each link
- The click-through rate (%)
- The total number of clicks per link
When the same link appears in both a dynamic block and a regular block, clicks are tracked separately.
- The statistics for the dynamic block include only the clicks made on that link within the dynamic block.
- These clicks are not counted in the statistics for the same link if it appears in a non-dynamic block.
This separation allows for a more detailed performance analysis. For example, you can compare whether a link generates more clicks when displayed in a dynamic block, where it is presented in a more personalized context for the recipient.
Managing Groups and Exporting Statistics
You can select blocks or links and add them to a group by clicking the Add to a group button from a statistic. This feature is available in both the Dynamic Blocks table and the Link Statistics by dynamic block table.
Additionally, you can export the statistics of your choice by selecting the corresponding checkboxes and clicking the Export Statistics (.xlsx) button. The export generates a file containing detailed data on dynamic blocks or links, including the number of recipients, the number of delivered emails, as well as the number of opens and clicks, depending on the selected options.

Export mailings statistics
It is possible to export:
- The global statistics of all your mailings
- The statistics of one single mailing
- The incorrect addresses or the list of contacts who unsubscribed from a mailing
- The list of contacts for a specific mailing statistic
Export global statistics of all mailings
To export the global statistics for all your previous mailings to an Excel file, click on the Export button on the Global Statistics page.

Export statistics of one single mailing
- Go to and click on the Previous mailings tab.
- In that page, click on the icon at the end of a row to open the action menu. Click on the option.
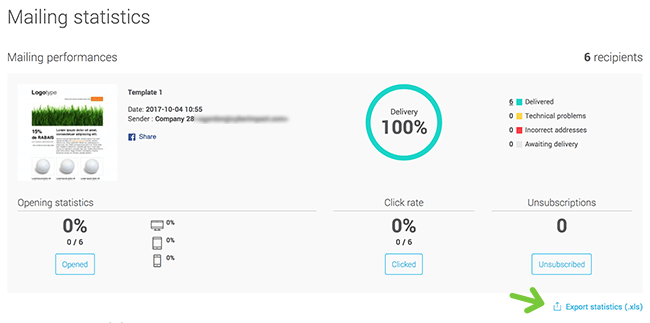
- Then, click on the Export statistics link under your mailing's performances.

Note: if it's your most recent mailing, the mailing performance box and export link will also be displayed on your dashboard.
Export the incorrect addresses or the list of contacts who unsubscribed from a mailing
To learn how, follow the steps here >
Export the list of contacts for a specific mailing statistic
To learn how, follow the steps here >
Create a group from a statistic
To learn how, follow the steps here >
